NESA is regularly updating its advice as the coronavirus outbreak unfolds. Get our latest COVID-19 advice

This webpage has been archived to prepare for transfer to the new NESA website. Reference to syllabus outcomes and content on this webpage may not be current. Teachers are encouraged to visit the Key Learning Area page for recent student work samples on the NESA website.

Assessment Resource Centre (ARC)

    Home
  1. Years 9-10
  2. Mathematics
  3. Activities
  4. Describing Travel Graphs
  5. Worksheet
Print this page Reduce font size Increase font size

Worksheet

Stage 5.2 – activity or task 1 Worksheet

Describing Travel Graphs

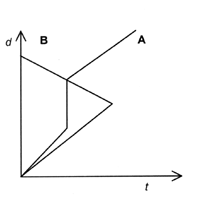
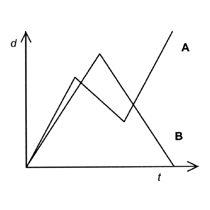
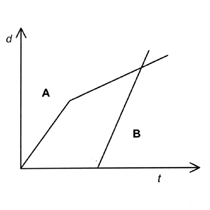
Consider the distance/time graphs below. For each pair of graphs write a brief description of the journey that graph A and graph B might represent.

Some graphs do not represent possible journeys. For these, explain why not.
activity or task 4 Worksheet graph 1
 
activity or task 4 Worksheet graph 2
 
activity or task 4 Worksheet graph 3
 

Print this page Reduce font size Increase font size